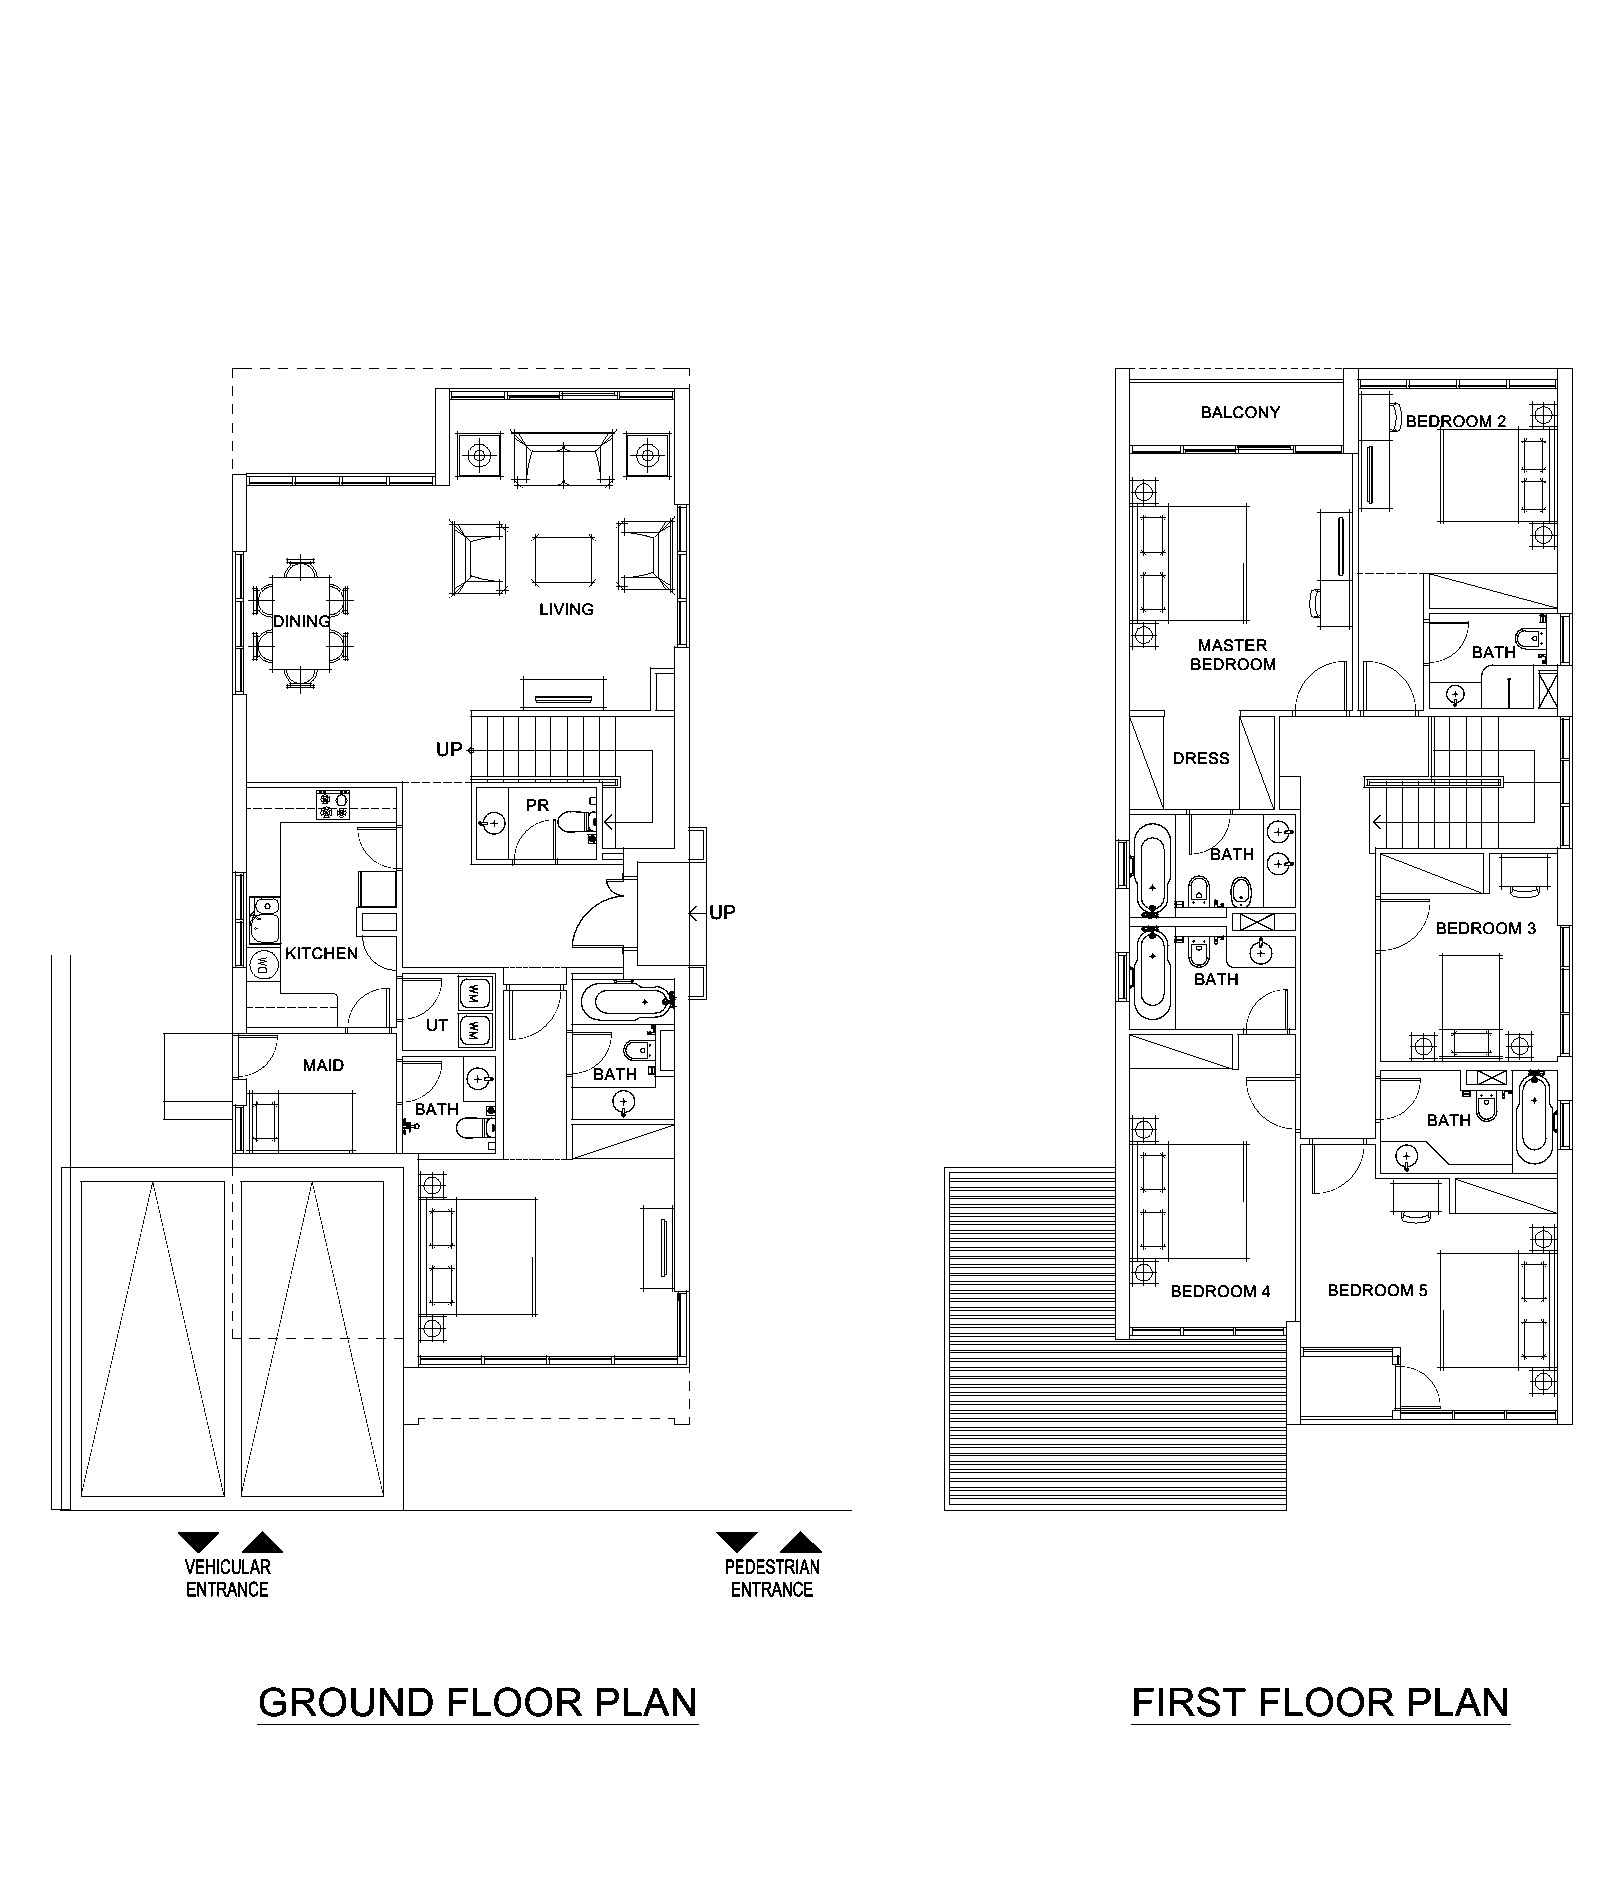
Acacia Avenues Villas
UAE > Dubai > Al Sufouh > Al Sufouh 1 > Acacia Avenues > Acacia Avenues Villas
Details
Read More
Description
N/A
Location & Nearby
456G+CW6 - Al Sufouh - Al Sufouh 1 - Dubai - United Arab Emirates

Location

Schools

Restaurants

Hospitals
Metro Stations
Shopping Malls
Hotels